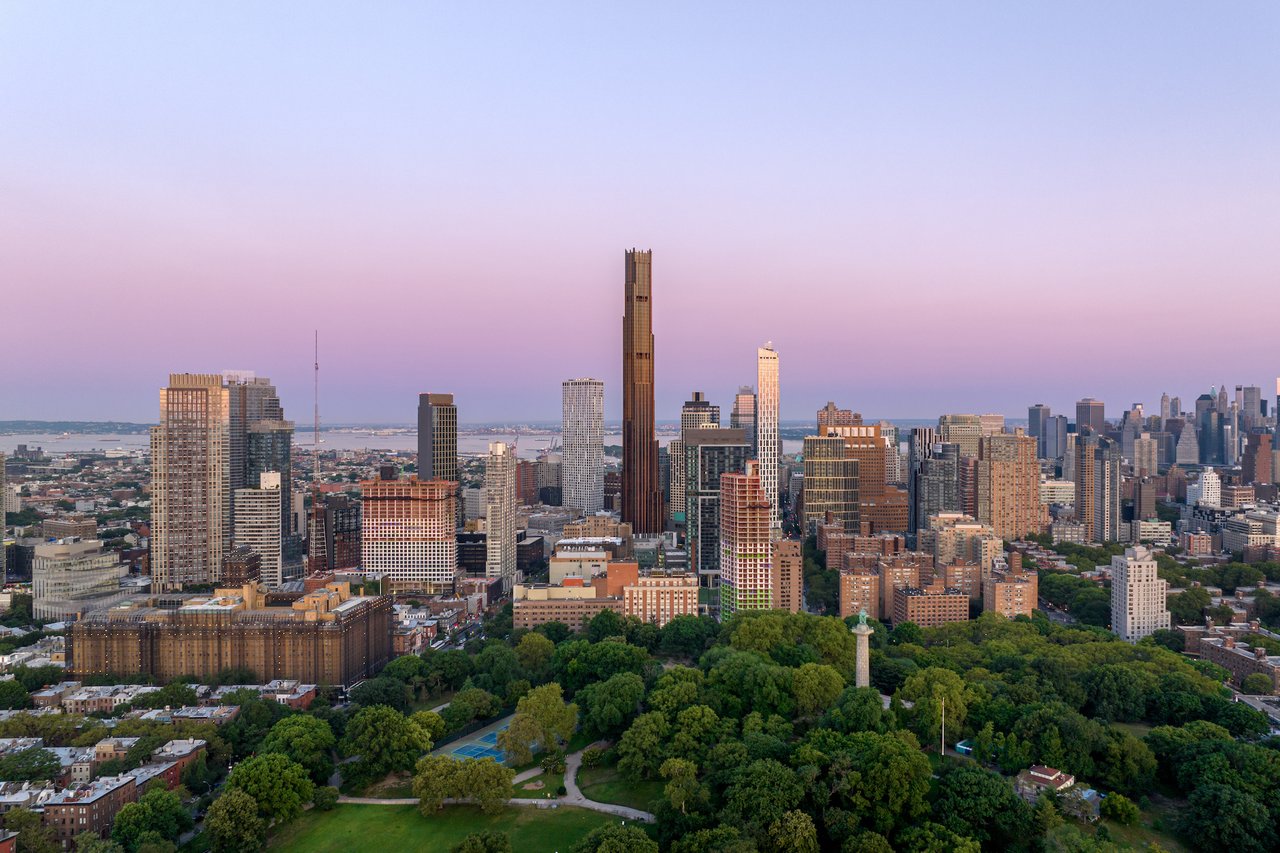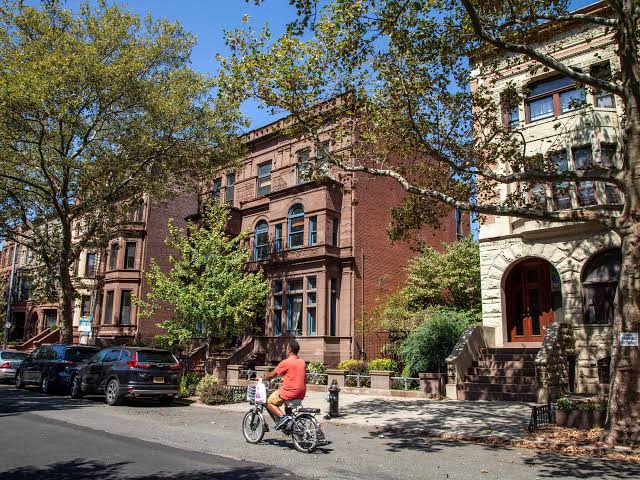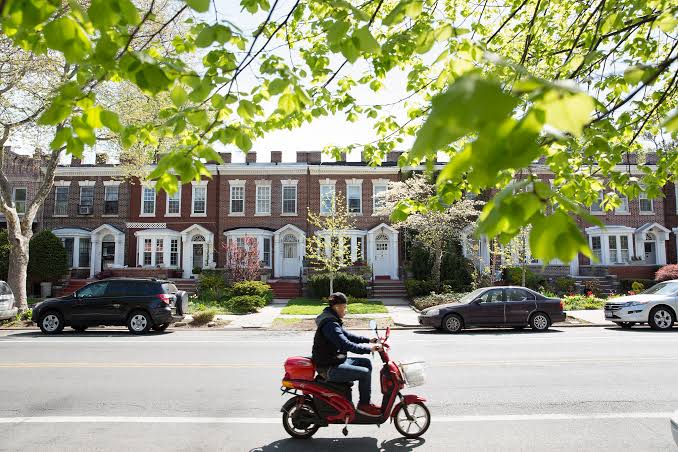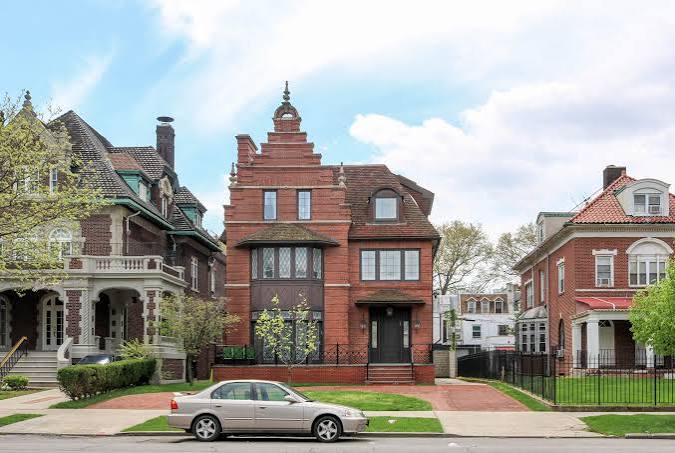
Crown Heights gained sales and price momentum in Q3 2026, but the clearest shift happened inside the market: condo activity surged while houses required more patience and negotiation.
A total of 106 homes worth $159.9 million closed during the quarter. The median sale price reached $1,395,000, up 9.4% year over year, while condo sales increased sharply from the same quarter last year.
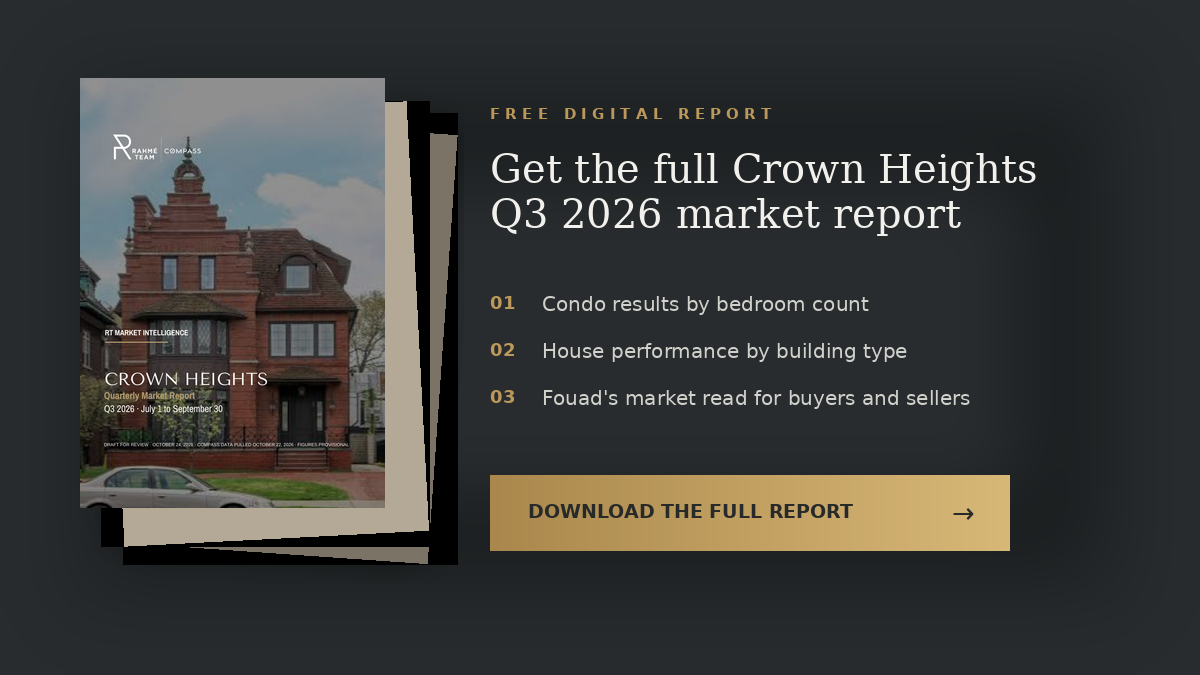
This page covers the essential market signals. The complete report adds condo results by bedroom count, house performance by building type, the full price-reduction analysis and detailed buyer and seller guidance.
Crown Heights at a glance
These figures describe the homes that sold and should not be interpreted as the change in value of an individual property. Asking-price results compare the closed price with the original list price.
Three segments, three different markets
Houses and condos divided the market almost evenly, yet they behaved differently. Condos sold faster and stayed closer to original ask; the two co-op sales were too small a sample for reliable conclusions.
Property type | Sales | Median price | Average price | Median DOM | Avg. vs original ask |
|---|---|---|---|---|---|
1 to 4 family homes | 53 | $1,750,000 | $1,854,560 | 67 | 6.6% below |
Condominiums | 51 | $1,240,000 | $1,177,486 | 46 | 0.2% below |
Co-operative apartments | 2 | Small sample | Small sample | Small sample | Small sample |
All Crown Heights | 106 | $1,395,000 | $1,508,193 | 54 | 2.6% below |
DOM = days on market. Property-type results use only transactions reporting the relevant metric. Small-sample results are labeled rather than overinterpreted. The full report provides sample sizes and deeper breakdowns.
Condos drove the growth
Condo sales rose to 51 from 30 a year earlier, including 11 closings at 817 Classon Avenue. Houses still held the higher price band, but they generally waited longer and negotiated further from original ask.
Homes that missed the market paid for it
Pricing strategy produced one of the quarter’s clearest differences.
On a $1.75 million house, the gap between those average outcomes is approximately $239,750. This does not prove that pricing alone caused every result, but it shows why the opening strategy matters.
What buyers and sellers should notice
1 to 4 Family Homes
Houses remained the higher-priced half of the market, with a $1.75 million median, but the typical reporting sale took 67 days and finished below original ask.
The full report: performance by building type.
Condominiums
Condo sales climbed 70% year over year to 51, with a $1.24 million median and a faster 46-day market time.
The full report: results by bedroom count.
Co-operative Apartments
Only two co-ops closed, too few for a dependable segment-level price or timing conclusion.
The full report: the individual small-sample context.
Crown Heights did not move as one market this quarter. Condos supplied the growth and stayed close to asking, while houses demanded a more disciplined pricing and negotiation strategy.
Fouad Rahmé, Principal & Founder, Rahmé Team at Compass
Closed sales cannot establish today’s inventory or competition. Current listings and buyer feedback also matter.
What does this market mean for your home?
A neighborhood median cannot price your block, building, renovation or property type. Speak with Fouad about the recent sales most relevant to your plans.
Crown Heights Q3 2026 market questions
Click the + sign to reveal each answer.
What was the median Crown Heights home price in Q3 2026?
The median across 106 house, condo and co-op sales was $1,395,000, up 9.4% from Q3 2025 and 0.8% from Q2 2026.
How many Crown Heights homes sold in Q3 2026?
There were 106 sales, up 19.1% year over year and down 8.6% from Q2 2026.
Were Crown Heights homes selling above asking?
Among 75 sales, the average sale finished 2.6% below original ask. Condos averaged 0.2% below, while houses averaged 6.6% below.
How long did it take to sell a Crown Heights home?
The neighborhood-wide median was 54 days: 46 days for condos and 67 days for houses.
What drove Crown Heights sales growth?
Condos drove the year-over-year increase, rising to 51 sales from 30. Eleven of the quarter’s condo closings were at 817 Classon Avenue.
What is included in the full report?
The full report adds condo performance by bedroom count, house results by building type, the complete price-reduction analysis, buyer and seller recommendations and detailed methodology.

Fouad Rahmé
Principal & Founder, Rahmé Team at Compass
The Rahmé Team advises buyers, sellers, investors and developers across Brooklyn, with 40 years of combined experience, more than 1,000 clients and transactions, and over $800 million in career sales. RealTrends Verified ranks the team in the top 1.5% of real estate professionals nationwide.
Contact the team or call (718) 233-3365.
Rahmé Team is committed to the principles of the Fair Housing Act. We do not discriminate on the basis of race, color, national origin, religion, sex, disability or familial status. All real estate advertising on this site is subject to the Fair Housing Act.